When a healthcare client came to us with a Drupal 10 site scoring 34 on Lighthouse, we knew we had work to do. Here is the full breakdown of our process.
The audit
We started with a Lighthouse audit on a cold cache, followed by a WebPageTest run from a US East Coast server. The main culprits: unoptimised images (average 2.3MB per page), render-blocking JavaScript from three abandoned plugins, and a PHP opcode cache that had never been configured.
What we fixed
- Converted all images to WebP with responsive srcsets
- Removed 4 unused JavaScript libraries totalling 340KB
- Configured OPcache and Memcached for Drupal
- Implemented Critical CSS inlining
- Added a CDN layer with Cloudflare
Results
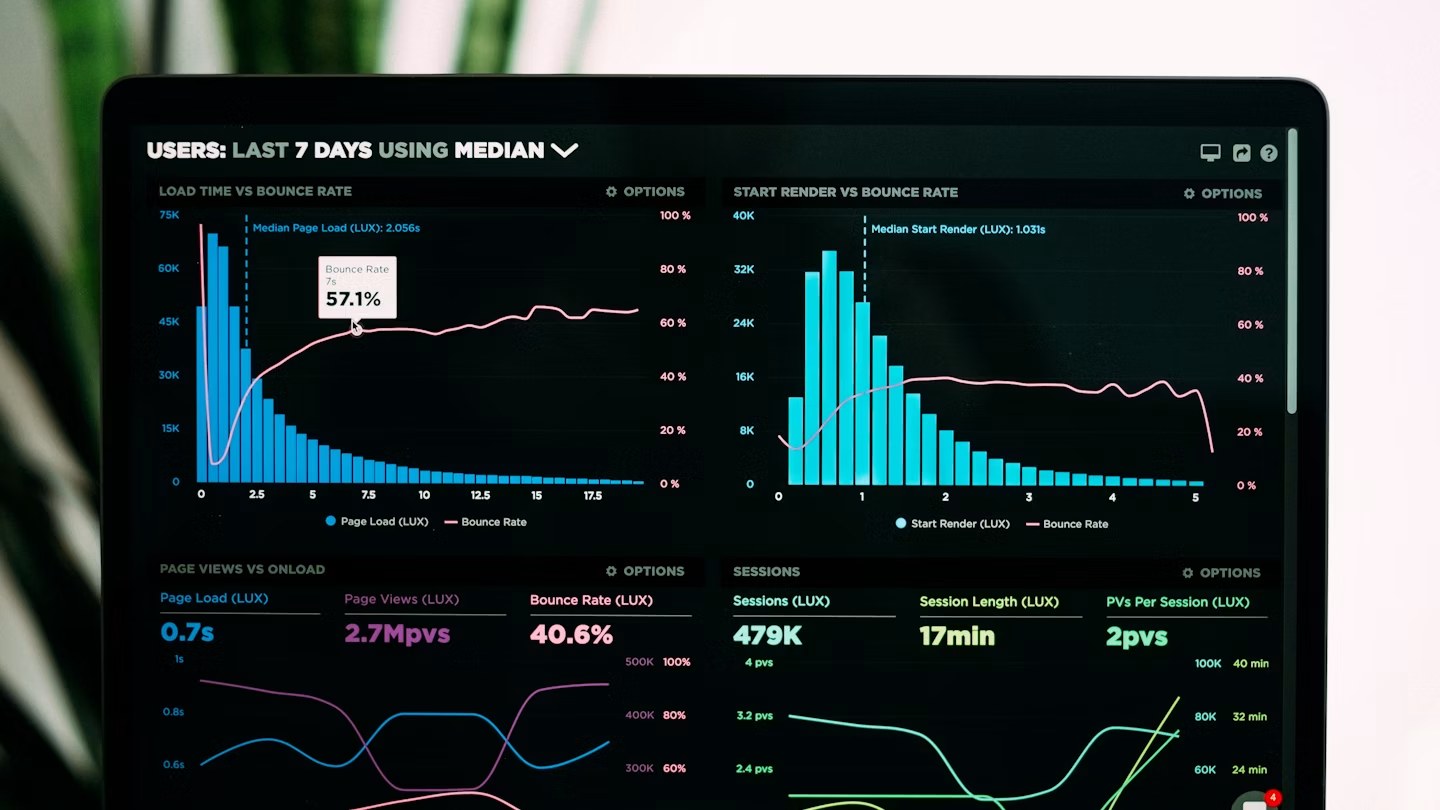
Lighthouse score: 34 → 91. Time to First Byte: 1.2s → 0.28s. Largest Contentful Paint: 5.8s → 1.4s. The client saw a 23% reduction in bounce rate within 30 days.